Spring Boot Admin 管理界面
Spring Boot Admin 是一个用于管理和监控 Spring Boot 应用的可视化界面,提供了应用健康状态、日志查看、JVM 监控等功能。
Spring Boot Admin 将 Actuator 端点数据可视化,无需编写任何前端代码,即可获得专业的监控界面。
📊 什么是 Spring Boot Admin
Spring Boot Admin (SBA) 是一个开源的可视化监控工具,主要特点:
- 📺 可视化界面 - 将 Actuator 数据以友好的方式展示
- 🔔 状态告警 - 应用状态变化时发送通知
- 📊 实时监控 - JVM、线程、HTTP 请求实时数据
- 📝 日志管理 - 在线查看和下载日志文件
- 🌐 多应用管理 - 统一管理多个 Spring Boot 应用
🏗️ 架构说明
Spring Boot Admin 采用 Server-Client 架构:
┌─────────────────────┐
│ Blog Application    │
│  (Admin Client)     │
│                     │
│  - Actuator 端点    │──┐
│  - 自动注册         │  │
└─────────────────────┘  │
                         │  注册
┌─────────────────────┐  │
│ Article Service     │  │
│  (Admin Client)     │──┤
└─────────────────────┘  │
                         │
┌─────────────────────┐  │
│ Comment Service     │  │
│  (Admin Client)     │──┤
└─────────────────────┘  │
                         ▼
          ┌─────────────────────────┐
          │ Admin Server (9000)     │
          │                         │
          │  - Web UI               │
          │  - 应用注册中心         │
          │  - 数据聚合展示         │
          └─────────────────────────┘
#️⃣ 版本信息
| 组件 | 版本 |
|---|---|
| Spring Boot | 3.5.7 |
| Spring Boot Admin | 3.5.5 |
| Java | 21 |
Spring Boot Admin 3.x 仅支持 Spring Boot 3.x 和 Java 17+
🔧 Server 端配置
1. 创建 Admin Server 模块
模块位置: blog-admin-server
目录结构:
blog-admin-server/
├── pom.xml
└── src/main/
    ├── java/com/blog/
    │   └── AdminServerApplication.java
    └── resources/
        └── application.yaml
2. 依赖配置
pom.xml:
<dependencies>
    <!-- Spring Boot Admin Server -->
    <dependency>
        <groupId>de.codecentric</groupId>
        <artifactId>spring-boot-admin-starter-server</artifactId>
    </dependency>

    <!-- Spring Security (必需) -->
    <dependency>
        <groupId>org.springframework.boot</groupId>
        <artifactId>spring-boot-starter-security</artifactId>
    </dependency>

    <!-- Spring Web -->
    <dependency>
        <groupId>org.springframework.boot</groupId>
        <artifactId>spring-boot-starter-web</artifactId>
    </dependency>
</dependencies>
版本管理 (根 pom.xml):
<properties>
    <spring-boot-admin.version>3.5.5</spring-boot-admin.version>
</properties>

<dependencyManagement>
    <dependencies>
        <dependency>
            <groupId>de.codecentric</groupId>
            <artifactId>spring-boot-admin-starter-server</artifactId>
            <version>${spring-boot-admin.version}</version>
        </dependency>
    </dependencies>
</dependencyManagement>
3. 启用 Admin Server
AdminServerApplication.java:
package com.blog;

import de.codecentric.boot.admin.server.config.EnableAdminServer;
import org.springframework.boot.SpringApplication;
import org.springframework.boot.autoconfigure.SpringBootApplication;

@SpringBootApplication
@EnableAdminServer  // 启用 Admin Server
public class AdminServerApplication {
    public static void main(String[] args) {
        SpringApplication.run(AdminServerApplication.java, args);
    }
}
4. 应用配置
application.yaml:
server:
  port: 9000  # Admin Server 端口

spring:
  application:
    name: blog-admin-server

  # ============================================================
  # 安全配置 (CRITICAL!)
  # ============================================================
  security:
    user:
      name: admin             # 登录用户名
      password: "admin"       # ⚠️ 生产环境必须修改!
      # 建议使用环境变量: ${ADMIN_SERVER_PASSWORD}

  # ============================================================
  # Admin UI 自定义
  # ============================================================
  boot:
    admin:
      ui:
        title: "个人博客监控中心"  # 浏览器标签页标题
        brand: "<img src='assets/img/icon-spring-boot-admin.svg'><span> 博客后台监控 </span>"
        public-url: http://localhost:9000

# ============================================================
# Admin Server 自我监控
# ============================================================
management:
  endpoints:
    web:
      exposure:
        include: "health,info,metrics,prometheus"
  endpoint:
    health:
      show-details: when_authorized  # 登录后显示详情
- 生产环境禁止使用默认密码!
- 建议使用强密码或 OAuth2 认证
- 通过环境变量注入密码:
${ADMIN_SERVER_PASSWORD}
5. 自我监控
Admin Server 自身也是一个 Spring Boot 应用,同样需要监控。
配置自我监控端点:
management:
  endpoints:
    web:
      exposure:
        include: "health,info,metrics,prometheus"
  endpoint:
    health:
      show-details: when_authorized
访问:
http://localhost:9000/actuator/healthhttp://localhost:9000/actuator/metrics
💻 Client 端配置
1. 添加 Client 依赖
blog-application/pom.xml:
<dependency>
    <groupId>de.codecentric</groupId>
    <artifactId>spring-boot-admin-starter-client</artifactId>
</dependency>
2. 自动注册配置
无需额外配置!
Spring Boot Admin Client 会通过 Service Discovery 或默认配置自动注册到 Admin Server。
(可选)显式配置:
spring:
  boot:
    admin:
      client:
        url: http://localhost:9000  # Admin Server 地址
        instance:
          name: ${spring.application.name}
          service-url: http://localhost:8080
如果使用 Eureka/Consul 等服务注册中心,Admin Server 会自动发现所有注册的应用,无需 Client 配置。
3. 日志文件配置
为了让 Admin Server 能够查看日志,需要配置日志文件输出:
logging:
  file:
    name: logs/personal-blog-service.log  # 日志文件路径
  level:
    root: INFO
    com.blog: INFO
Actuator 暴露 logfile 端点:
management:
  endpoints:
    web:
      exposure:
        include:
          - logfile  # 暴露日志文件端点
🎨 功能介绍
1. 应用列表
界面: Admin Server 首页
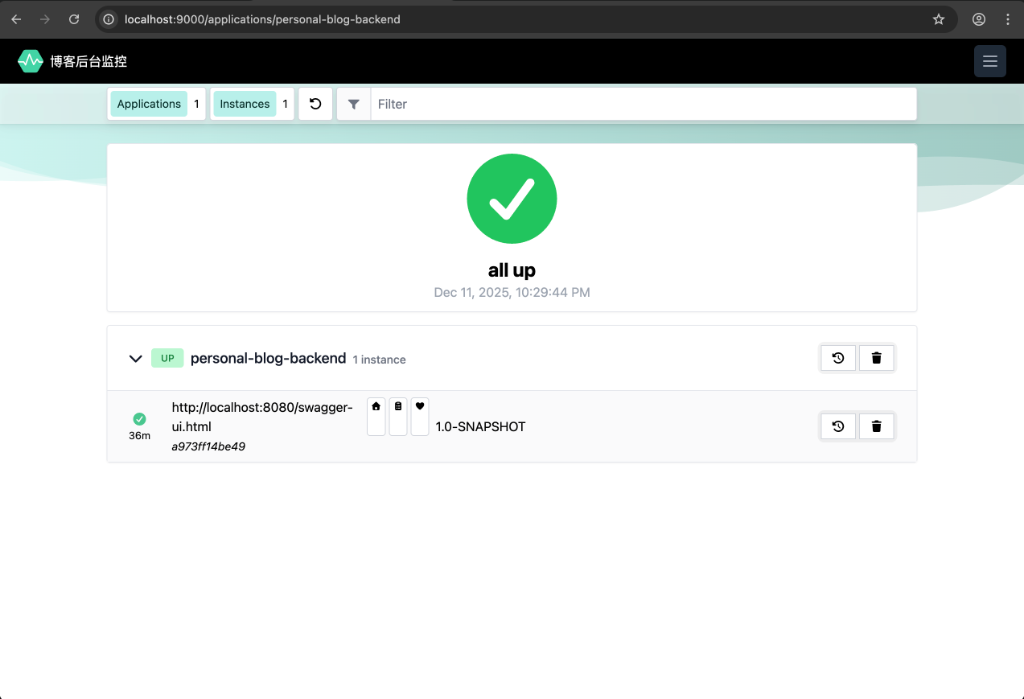
功能:
- 📊 应用状态总览(UP/DOWN)
- 🔢 实例数量统计
- 📈 内存使用概览
- ⏱️ 启动时间显示
状态标识:
- 🟢 UP - 应用健康
- 🔴 DOWN - 应用不可用
- 🟡 OFFLINE - 应用离线
- 🔵 UNKNOWN - 未知状态
2. 健康状态监控
路径: 应用详情 → Health
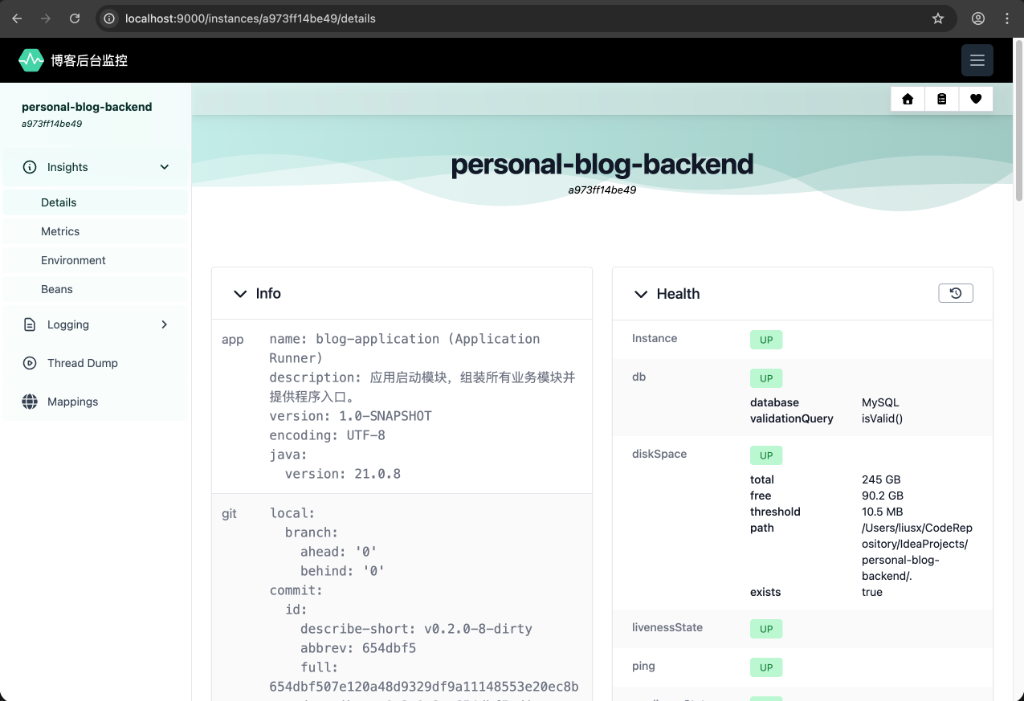
展示内容:
- 整体健康状态
- 数据库连接状态
- Redis 连接状态
- 磁盘空间状态
- 自定义健康检查
示例界面:
✅ Status: UP

Components:
  ✅ db: UP
     - database: MySQL
     - validationQuery: isValid()

  ✅ diskSpace: UP
     - total: 250 GB
     - free: 100 GB
     - threshold: 10 MB

  ✅ redis: UP
     - version: 7.2.0

  ✅ ping: UP
3. 日志查看
路径: 应用详情 → Logfile
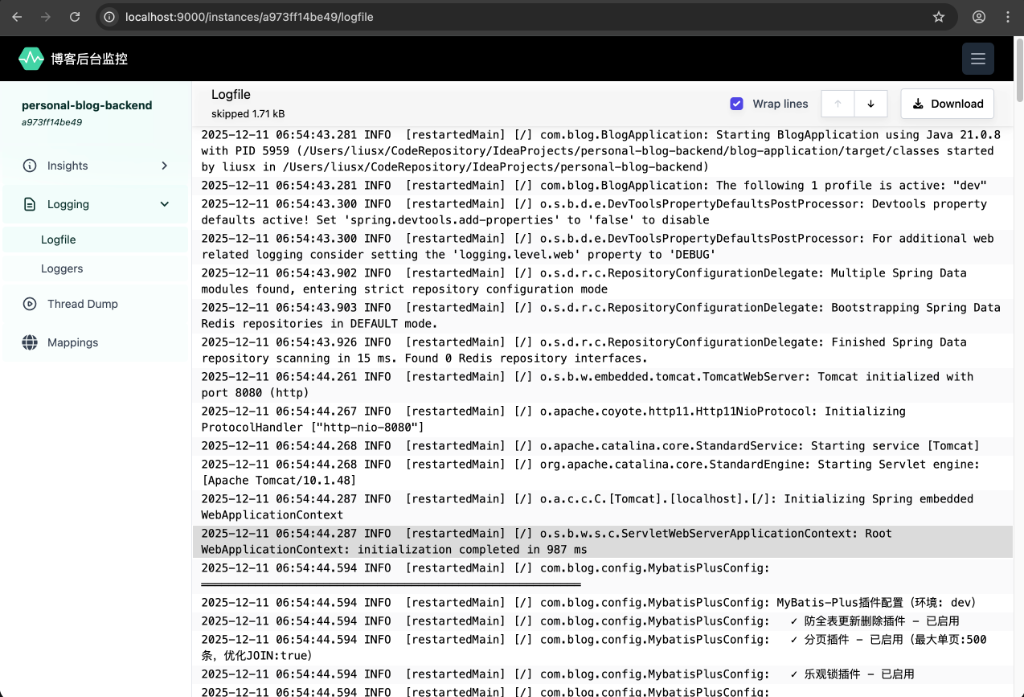
功能:
- 📖 实时查看日志
- 📥 下载日志文件
- 🔍 日志搜索
- 📊 按时间过滤
使用方法:
- 点击应用名称进入详情页
- 选择 "Logfile" 选项卡
- 实时查看最新日志
- 点击 "Download" 下载完整日志
4. JVM 监控
路径: 应用详情 → Metrics → JVM
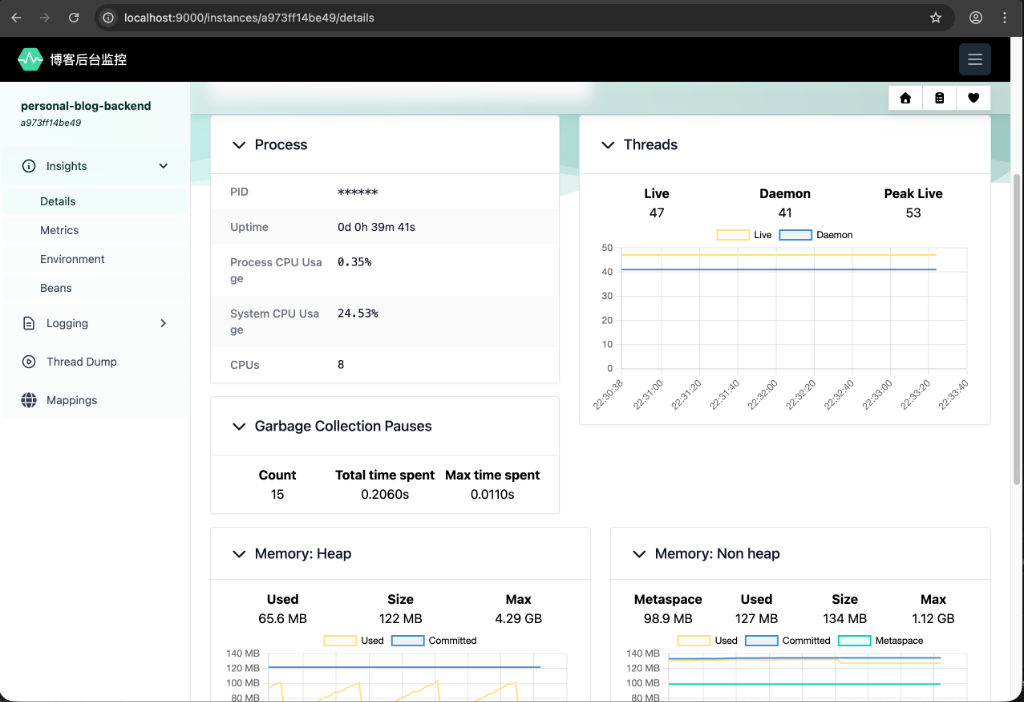
监控指标:
- 💾 内存使用: Heap、Non-Heap、各内存区
- 🧵 线程数: 活跃线程、守护线程
- 🗑️ GC 统计: GC 次数、GC 耗时
- 📦 类加载: 已加载类、已卸载类
可视化图表:
- 内存使用趋势图
- 线程数变化图
- GC 暂停时间分布
5. HTTP 请求监控
路径: 应用详情 → Metrics → Http
展示内容:
- 📊 请求总数
- ⏱️ 平均响应时间
- 🚀 最快/最慢请求
- 📈 QPS 统计
- 🔢 状态码分布(200/404/500)
按 URI 分类:
/api/users      - 42 requests, avg 12ms
/api/articles   - 38 requests, avg 25ms
/api/comments   - 15 requests, avg 8ms
6. 环境变量管理
路径: 应用详情 → Environment
功能:
- 查看所有配置属性
- 查看环境变量
- 查看系统属性
- 搜索特定配置
示例:
server.port: 8080
spring.application.name: personal-blog-backend
spring.datasource.url: jdbc:mysql://localhost:3306/blog
java.version: 21.0.1
敏感信息(如密码)会被脱敏显示为 ******
7. 线程管理
路径: 应用详情 → Threads
功能:
- 📊 线程总数统计
- 🔍 查看线程堆栈
- 🎯 查找特定线程
- 📥 下载线程转储
线程状态:
RUNNABLE- 运行中WAITING- 等待中BLOCKED- 阻塞TIMED_WAITING- 定时等待
🌐 访问和使用
1. 启动 Admin Server
# 进入 admin-server 目录
cd blog-admin-server

# 启动(方式1:Maven)
mvn spring-boot:run

# 启动(方式2:JAR)
java -jar target/blog-admin-server-1.0-SNAPSHOT.jar
2. 访问 Admin UI
URL: http://localhost:9000
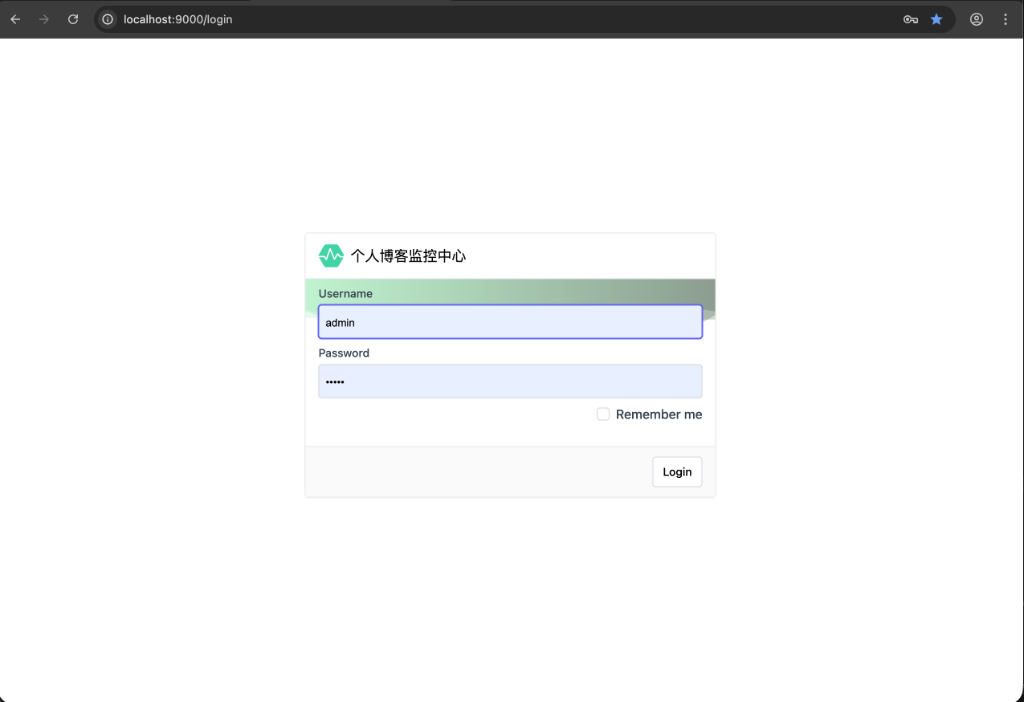
登录信息:
- 用户名:
admin - 密码:
admin
3. 管理应用
- 查看应用列表 - 首页显示所有注册的应用
- 进入应用详情 - 点击应用名称
- 查看 Wallboard - 总览所有应用状态
- 查看日志 - Logfile 选项卡
- 监控 JVM - Metrics → JVM
- 查看线程 - Threads 选项卡
🔔 (可选)告警配置
Admin Server 支持多种告警方式(需额外配置):
1. 邮件告警
spring:
  boot:
    admin:
      notify:
        mail:
          enabled: true
          to: "admin@example.com"
          from: "monitor@example.com"

  mail:
    host: smtp.example.com
    port: 587
    username: "monitor@example.com"
    password: "${SMTP_PASSWORD}"
依赖:
<dependency>
    <groupId>org.springframework.boot</groupId>
    <artifactId>spring-boot-starter-mail</artifactId>
</dependency>
2. Slack 告警
spring:
  boot:
    admin:
      notify:
        slack:
          enabled: true
          webhook-url: "${SLACK_WEBHOOK_URL}"
          channel: "#monitoring"
          username: "Admin Server"
3. 钉钉告警
spring:
  boot:
    admin:
      notify:
        dingtalk:
          enabled: true
          webhook-url: "${DINGTALK_WEBHOOK}"
🔐 生产环境注意事项
1. 安全加固
使用环境变量:
spring:
  security:
    user:
      name: ${ADMIN_USERNAME:admin}
      password: ${ADMIN_PASSWORD}  # 必须通过环境变量注入
启用 HTTPS:
server:
  port: 9443
  ssl:
    enabled: true
    key-store: classpath:keystore.p12
    key-store-password: ${KEYSTORE_PASSWORD}
    key-store-type: PKCS12
2. 反向代理
Nginx 配置:
server {
    listen 443 ssl;
    server_name admin.example.com;

    ssl_certificate /path/to/cert.pem;
    ssl_certificate_key /path/to/key.pem;

    location / {
        proxy_pass http://localhost:9000;
        proxy_set_header Host $host;
        proxy_set_header X-Real-IP $remote_addr;
        proxy_set_header X-Forwarded-For $proxy_add_x_forwarded_for;
        proxy_set_header X-Forwarded-Proto $scheme;
    }
}
3. 访问控制
IP 白名单示例:
@Bean
public SecurityFilterChain filterChain(HttpSecurity http) {
    http.authorizeHttpRequests(auth -> auth
        .requestMatchers("/actuator/**").hasIpAddress("10.0.0.0/8")
        .anyRequest().authenticated()
    );
    return http.build();
}
🐛 常见问题
Q1: 应用无法注册到 Admin Server
可能原因:
- Admin Server 地址配置错误
- 网络不通
- 安全验证失败
排查步骤:
# 1. 检查 Admin Server 是否启动
curl http://localhost:9000/actuator/health

# 2. 检查客户端日志
grep "admin" logs/application.log

# 3. 验证网络连接
telnet localhost 9000
Q2: 日志无法查看
原因: 未配置日志文件或未暴露 logfile 端点
解决:
# 1. 配置日志文件
logging:
  file:
    name: logs/application.log

# 2. 暴露 logfile 端点
management:
  endpoints:
    web:
      exposure:
        include: logfile
Q3: 登录后显示空白页
原因: 浏览器缓存或前端资源加载失败
解决:
- 清除浏览器缓存
- 强制刷新(Ctrl + F5)
- 检查浏览器控制台错误
📚 延伸阅读
- Actuator 使用指南 — 监控端点配置
- Micrometer 指标监控 — 自定义业务指标
- Security 概述 — 安全配置
- Spring Boot Admin 官方文档
文档更新日期: 2025-12-11
Spring Boot Admin 版本: 3.5.5